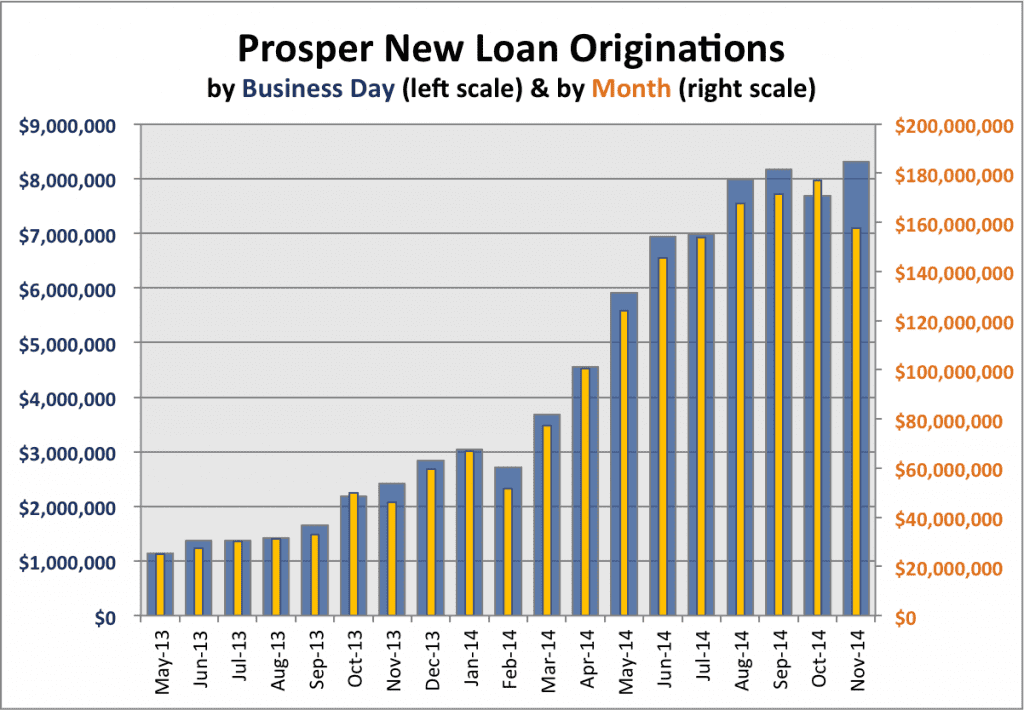
In the short month of November Prosper issued $158 million in new loans. This was down from $177 million in October and on the face of it this seems like a bad result for Prosper with monthly originations down 10.8% month over month.
But as Aaron Vermut, the CEO of Prosper, pointed out to me the total monthly number can provide a misleading picture. How so? I alluded to it in the first sentence of this story. Some months have far fewer business days than other months. The metric that Prosper likes to focus on is average daily origination numbers. This makes sense and is something I used to focus on in my previous businesses. The number of working days each month fluctuates between 19 and 23 depending on the month (taking into account weekends and holidays). So, by including average daily loan originations this provides a more complete picture of what is happening.
For this reason you will see in a new look chart above. I have included a new metric on my Prosper chart: average daily originations. I have taken into account holidays and weekends to provide the number of working days for each month so I can calculate the average daily originations number. As you can see even though the total November originations were down significantly from October the daily average actually went up and it was in fact a record month at Prosper.
November also marked a milestone at Prosper that I wrote about here. After more than eight years of red ink Prosper turned the corner in the third quarter and recorded their first ever quarterly profit as stated in their Form 10-Q.
Below are the key stats I track for November.
Average loan size: $13,260
Average dollars issued per business day: $8.3 million
Percentage 36/60 month loans: 66.9%/33.1%
Average interest rate: 14.8%
Percentage of whole loans: 91.6%
Average FICO score: 699

