Whenever you make an investment in either Lending Club or Prosper you are presented with an estimate of your return for that particular investment. But what does that really mean?
The Expected Default Rate at Lending Club
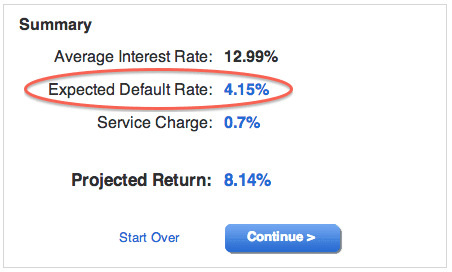
Let’s take a look at this graphic from Lending Club to explain how they calculate projected return. In this particular case I have chosen to invest in one 36-month loan that is rated B4 with an interest rate of 12.99%.
This expected default rate of 4.15% in this example is the expected percentage of principal loss for the entire population of 3-year B4-grade issued by Lending Club today. It is based on Lending Club’s proprietary algorithm and is different for every interest rate. They have built this expectation based on their own experience of their historical loans. They adjust this number from time to time, in fact, just recently (in June) they made a significant adjustment to the expected default rate for every loan grade.
The Mistake Many New Investors Make
The projected return number of 8.14% isn’t the return I will receive for this one investment as some new investors think. This is the expected return I would receive if I invested in a large basket of loans exactly like this one – as in 36-month, B4 loans at 12.99%.
Now, my expected return on this one note, if this borrower pays on time all the way to maturity, is going to be the interest rate less the service charge – in this case it will be 12.29%. But if I had thousands of loans like this one then Lending Club is suggesting that I will lose 4.15% of my principal to defaults.
Before we move on to Prosper let’s just say a word about service charge. The 0.7% number quoted by Lending Club is the impact of the 1% service charge on your returns if this note is paid exactly according to the amortization schedule. Why isn’t the impact 1%? Because this fee is not an annual charge, it is charged with every payment and each payment has a different mix of principal and interest. You can read more about service fees here.
The Estimated Loss Rate at Prosper
Prosper has a slightly different take on all this but the main idea of estimated default rate is the same. Before we get to estimated default rate, called estimated loss rate at Prosper, we should look at Prosper’s approach in a little more detail.
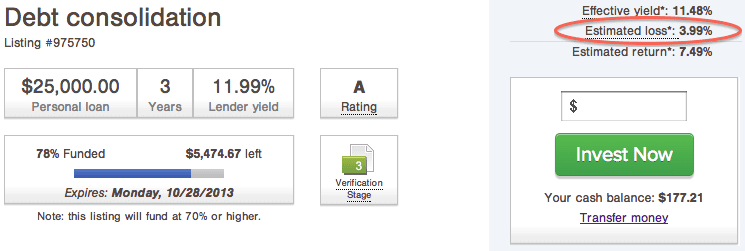
In the graphic above you will see an A-grade 3-year loan with the same 12.99% interest rate. What Prosper does right off the bat is deduct the full 1% service fee so the lender yield on this note is 11.99%. But then Prosper introduces the concept of effective yield, which is explained this way:
*Effective yield is equal to the borrower interest rate: (i) minus the servicing fee rate, (ii) minus estimated uncollected interest on charge-offs, (iii) plus estimated collected late fees.
To be honest I didn’t fully understand what all this meant so I placed a call to Josh Tonderys, the Chief Risk Officer at Prosper, to clarify it for me. With their effective yield number Prosper obviously takes into account the servicing fees which they keep at a flat 1%. Then what they also do is deduct the interest that is accrued when the loan goes late. Interest continues to accrue, even when no payments are made, before the note is charged off. And this accrued interest is also deducted to form the effective yield. There is also a slight upward adjustment due to estimated late fees collected.
What is interesting is when comparing apples to apples (these examples above are both 3-year loans at 12.99%) the estimated default rate at Prosper and Lending Club are quite similar: 3.99% versus 4.15%. But because Prosper calculates estimated return differently the expected bottom line is quite different: 7.49% versus 8.14%.
These Numbers are Very Important to the Platforms
I have seen some conversation on the forum about expected default rates and most investors seem to ignore these numbers. But the platforms don’t and neither do many institutional investors. They want want to hold the platforms accountable to their predictions. Lending Club and Prosper also want to be able to say they have beaten their projections.
When I have seen presentations at both companies these are the numbers they focus on: the actual return of the portfolio for a particular vintage versus what they said it would be. In an ideal world these numbers would be exactly the same. But clearly we do not live in an ideal world which is why these numbers continue to be tweaked by both platforms.


