Lending Club and Prosper have both been around over 10 years now. A lot has changed since both companies were founded, including the performance of the loans. In this blog post we’ll share the performance of each platform over the last 10 years. The fact that we have access to this data set is one of the things that makes marketplace lending unique. The screenshots from this post are taken from NSR Invest, a marketplace lending robo advisor that is also a sister company to Lend Academy.
In the early days of this industry, it was relatively easy to earn outsized returns. The early adopters, including Peter Renton, founder of Lend Academy, commonly touted double digit returns with a few simple filters. This was before both Lending Club and Prosper began to really scale with the arrival of institutional investors.
Lending Club Data
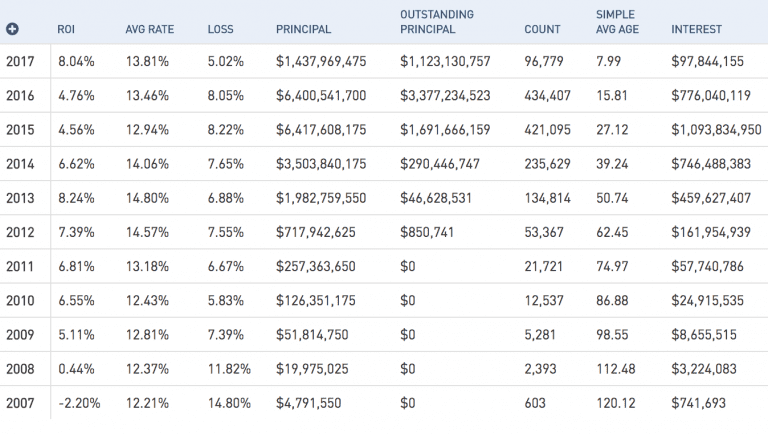
For Lending Club investors, most loan grade returns peaked in 2013. Below is a screenshot of platform performance for all loan grades across 36 and 60 month loans. As you look at this chart it is worth noting that the 2017 numbers are somewhat meaningless because the loans there have not seasoned yet. Also, it should be note that these numbers are only for Lending Club’s standard personal loan program, that which is available to individual investors (it does not include auto, small business or other special loan programs).
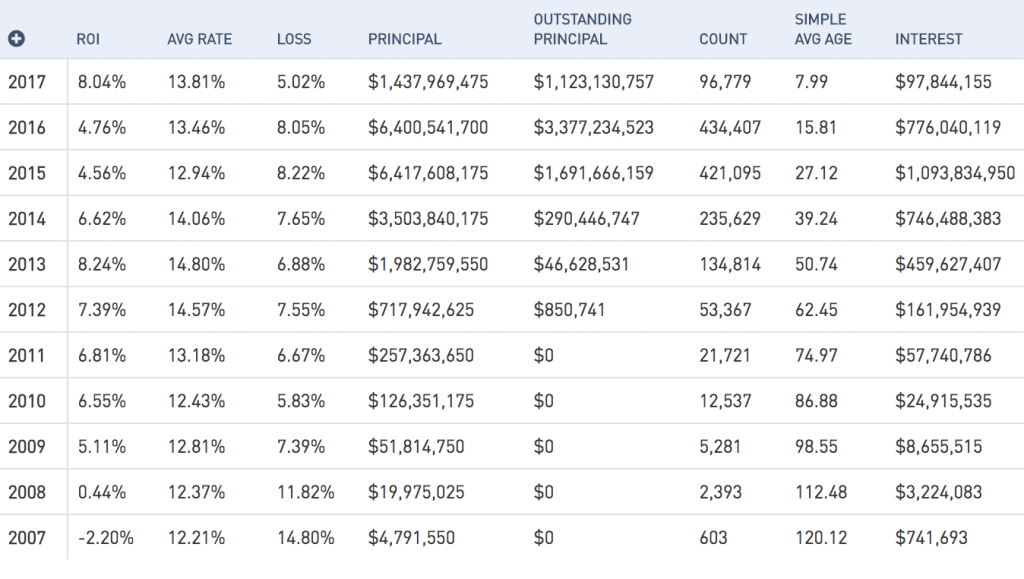
Looking at the above chart we see that 2013 was the high water mark for returns at Lending Club with 8.24%. While that is impressive, D grade loans performed even better returning 9% to investors that year. The below screenshot shows performance across D grade loans over the years.
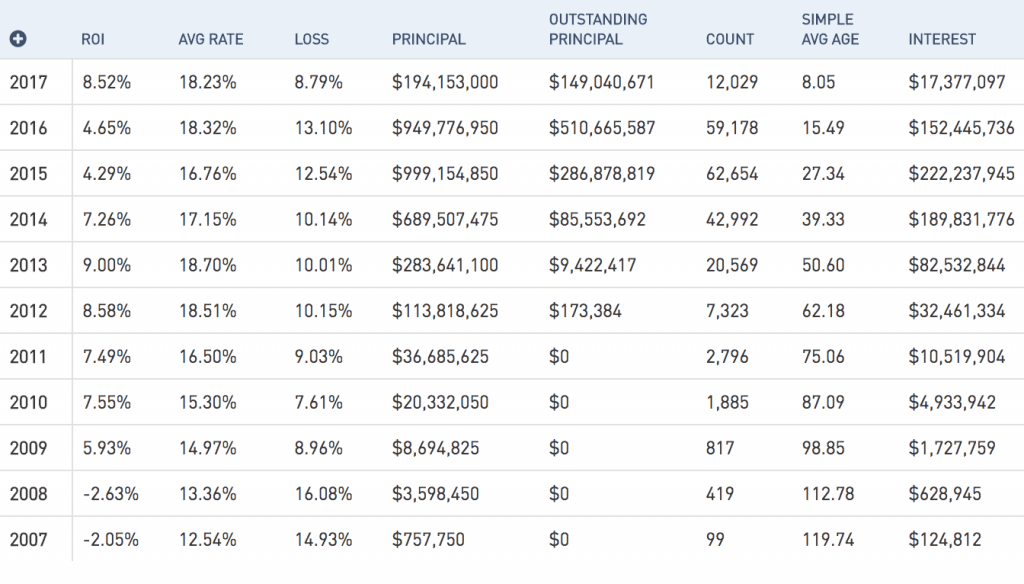
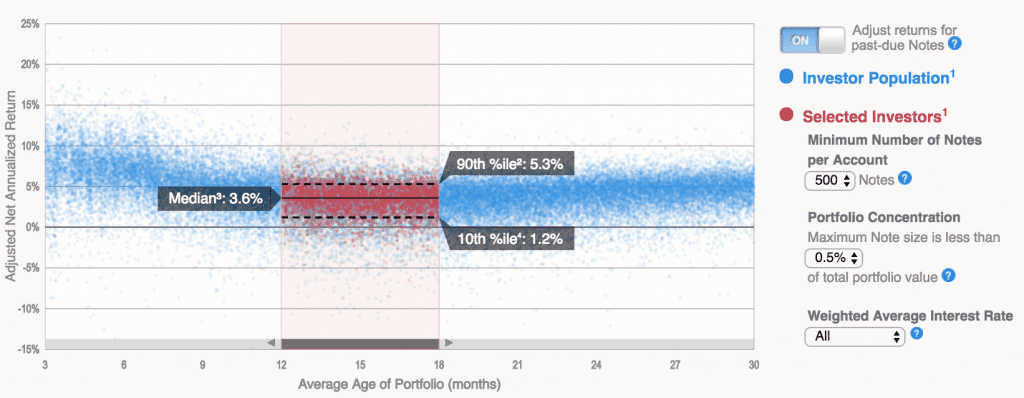
Generally speaking, Lending Club investors earned healthy returns if they began investing from 2010 onwards. These solid returns lasted until around the fourth quarter of 2015 when loan performance began to degrade, particularly with the high interest loans. The decreasing returns affected both Lending Club and Prosper and is a topic we have covered extensively. Perhaps the best way to show where investors currently stand is with the below chart taken directly from Lending Club’s statistics page.
Highlighted in red is the filtered selection including those investors with 500 or more notes where the maximum note size is less than 0.5% of the portfolio value. Each dot represents an individual investor. The highlighted range is where portfolios are considered seasoned. As you can see the overall return today for the typical investor is far less than it was back in 2013.
Prosper Data
[Update: Prosper reached out to us and informed us that the returns listed for Prosper are potentially higher than reported below. This is due to recoveries not being reflected properly by Prosper in the data that NSR Invest reports. NSR Invest is currently working to update the data accordingly and we will update the post when the new information is available.]
Prosper launched in 2006 as the first p2p lending platform in the U.S. Initially, they operated with a very different model allowing deep subprime borrowers on to their platform. This first iteration became known as Prosper 1.0 and it was not until 2009 when they reopened after their quiet period that Prosper became a lending platform focused on prime and near prime borrowers.
The below screenshot includes data since Prosper rebooted their platform in 2009. When they relaunched Prosper grew very slowly, they needed to prove out their platform to the many retail investors who had lost money in Prosper 1.0. Even in 2009 and 2010 originations were just $8 million and $27 million respectively. Prosper began to scale significantly in 2011 and onwards. Returns for the earlier vintages, particularly through 2013 were higher than we’ve seen in recent years.
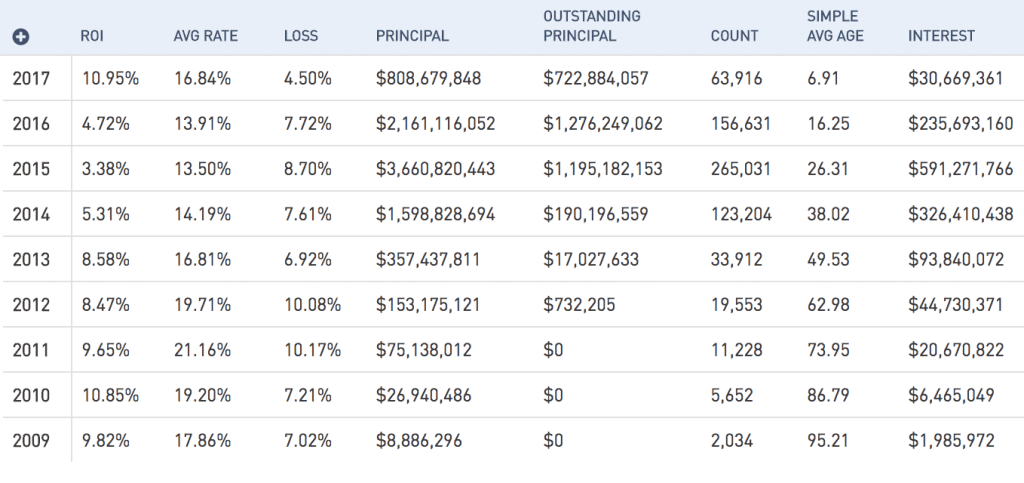
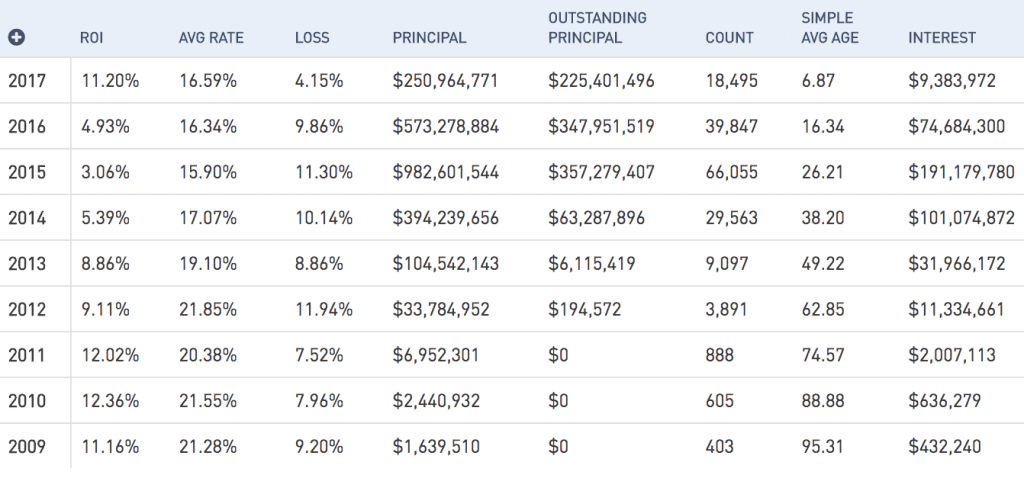
Prosper’s C grade loans are the closest to Lending Club’s D grade loans so this is the best side by side comparison. Returns are similar between both platforms in 2012 and 2013, but early investors on Prosper were rewarded with an index of C grade loans returning 12%. You can really see here how Prosper shifted their risk profile with C grade loans dropping from an average rate of 21.85% in 2012 to 15.90% in 2015.
Conclusion
When it comes to fixed income investments, marketplace lending loans have performed well over a period when most investors have been hungry for yield. It certainly has been an interesting ride for those investors who were the early investors in Lending Club and Prosper. Many of these individuals are still around today and hang out on the Lend Academy forum. Some investors on the forum have been vocal about what they are currently doing with their portfolios. Some have withdrawn money completely, shifted money to less risky note grades, began focusing on investing via the secondary market or pursued other investment opportunities entirely.
We are probably not going back to the double digit returns of several years ago but compared to other asset class marketplace lending has shown relatively consistent returns for diversified investors.


